
When should I buy a stock?
- Endsleigh Place
- Aug 11
- 5 min read
Updated: Aug 16
The simple mantra is: buy low, sell high. When you go clothes shopping, you might see a shirt at its normal retail price of £30, but you know that in two weeks the summer sales are starting, which means you could get up to 50% off. In two weeks, the same shirt is £15. Buying at that point, when the price is low, is more economical than buying when the price is high. While companies don't have strict 'sales' seasons, the strategy of buying quality at a low price is frequently applied to stocks. Most of us would have an idea of what 'high' could be; 100% after ten years of holding would be bang-on-average. This article looks at when low might be; the indicators you might use when working out when it's a good time to buy.
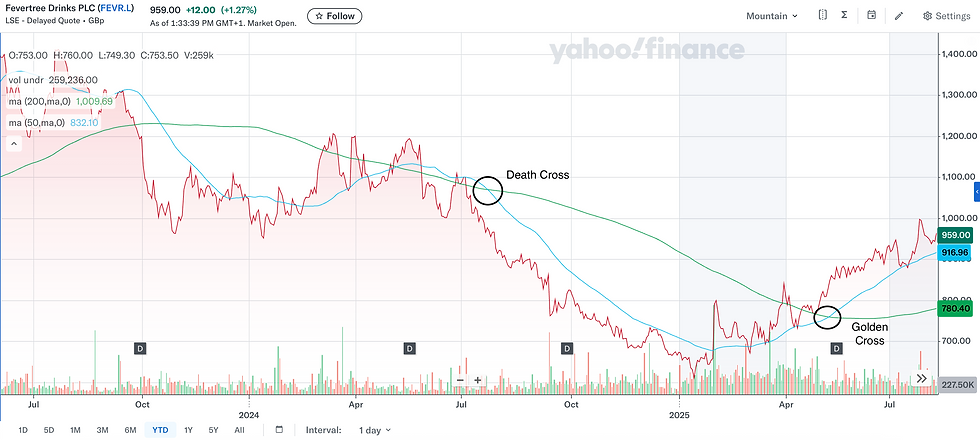
Moving Averages
Stock prices change constantly, but over periods of time you can average out the price by taking the closing price of the past five periods, say, days, and dividing by five. This will provide a five-day simple moving average that, on a chart, very closely follows the price. By increasing the periods to, say, 200 days, you get a 200-day simple moving average. This indicator gives a view of the 'long-term trends' for a stock's price. Generally, if the current price is below the stock's 200-day simple moving average, one might consider the stock as selling at a comparative discount.

How do you know whether a stock is on a long-run downward trend? Even if the stock is selling at a discount, who is to say it does not fall further tomorrow? Nothing, however, short-term price movements can be analysed to help inform a view in this respect. For example, if the time period for the moving average is decreased to 50 days, you get a fifty-day simple moving average. This indicator is very popular with traders, however, long-term investors can also make use of it to get a sense of the very short-term status of the stock.
All things being equal, if the current price is below the fifty-day simple moving average, that might indicate a short-term negative sentiment, suggesting the stock may fall further in the immediate future. If the price is above the fifty-day simple moving average, then this could indicate the price is on an upward trend. While each indicator removes 'noise' around a stock's current price, neither the 50-day nor the 200-day moving average alone is enough to begin to make an informed decision.
Putting the 50-day and the 200-day moving averages together, however, can give us the most utilised buy or sell signals: the Golden Cross or the Death Cross. A Golden Cross is when the 50-day moving average moves above the 200-day moving average; it suggests a short-term average price rise against the long-run trend price of the stock. A Death Cross is the inverse, and suggests the price will start to fall against its long-term value.
While these are very useful indicators, it is essential to bear in mind that these are 'lagging' indicators - they reflect momentum one way or another rather than represent precise turning points. So, while a moving average may be helpful to assess a stock's price direction, other indicators like Price-to-Earnings may be better at assessing relative price levels.
Price-to-Earnings Ratio
The Price-to-earnings ratio (PE ratio) tells you how many times a company's earnings you are paying for when you buy its stock. The PE ratio calculation is expressed as: PE Ratio equals stock price divided by earnings per share. In simple terms, if Fevertree's PE ratio is 45.62, then I am paying 45.62 times its earnings per share value for each share I buy. From this, we can begin to work out if one company is 'cheaper' than another.
Ideally, you'd buy the company with a lower PE ratio, but it would not be fair to compare the PE ratio of Amazon with the PE ratio of GSK, since they are companies from very different industries. So, it's good for finding discount values within a sector. For example, earlier this year the average PE ratio for pharmaceutical drug companies was about 20.9. Comparing Astrazeneca and GSK, they have respective individual PE ratios of 28.02 and 16.96. Purely based on PE ratios, GSK would be the better deal in terms of 'cheapness'.
This is only a guide; the most obvious reason for this is that a company's 'cheapness' does not indicate anything about its underlying quality. It may be the case that a low PE ratio means investors are actively rejecting that company owing to underlying issues. The inverse is also true: a high PE ratio does not mean you should not buy the company's shares. Sometimes a company's high price, with a sustained high PE ratio, indicates that the market is willing to pay a high price for the company's shares, suggesting high quality for future earnings.
Dollar-Cost Averaging Strategies
While the indicators above can be useful in planning 'buy' or 'sell' points, they are neither bulletproof nor entirely necessary for long-run investors. They should be used, alongside research into more long-run factors that will override short-term pricing, but they are at their heart mostly used by traders playing an entirely different game. If it is true that 'the more time holding a stock, the less likely you will lose money' is true, then it should not matter too much for a long-run trader when they buy (so long as some very simple due diligence is undertaken; e.g. do not buy during periods of obvious market 'hype').
Appreciating, however, that we do still want to mitigate the risk of sudden price swings the wrong way when either buying or selling, there is a more appropriate strategy that is preferable for long-run investors: dollar-cost averaging. This strategy means buying the same stock, with the same amount of money, at a given frequency. For example, you may want to invest £300 in Barclays, and you decide to do this by buying £50 worth of shares per month, on the 10th of every month (or the prior working day if the 10th falls on a weekend). Over the past six months, your purchases would look like this:
Date | Barclays Share Price | Number of Whole Shares Bought |
10 March 2025 | 284.55p | 17 |
10 April 2025 | 260.25p | 19 |
09 May 2025 | 307p | 16 |
10 June 2025 | 323.35p | 15 |
10 July 2025 | 343.65p | 14 |
08 August 2025 | 367.95 | 13 |
In total, you'd buy 94 shares at an average price of 310p over the six months. This outcome means that your investment strategy has effectively smoothed out the fluctuations in the stock price. Here, the investor was able to purchase in April at a discount to their March purchase. While the share price did rise from there, had the price continued to stay low as with a market downturn, then this strategy would have helped mitigate the risk of buying at a high point compared to if they had just invested the £300 in one hit.
Over time, gradual 'drip feeding' approaches are recommended and seen as far more useful than technical indicators because they smooth out volatility and fluctuations in stock price. They allow investors to navigate the short-term problems of price movements and effectively allow the investor to purchase the stock at its average price. These approaches also take the pressure off of having to interpret signals like moving averages and PE ratios that, as mentioned, are far from perfect.


Comments